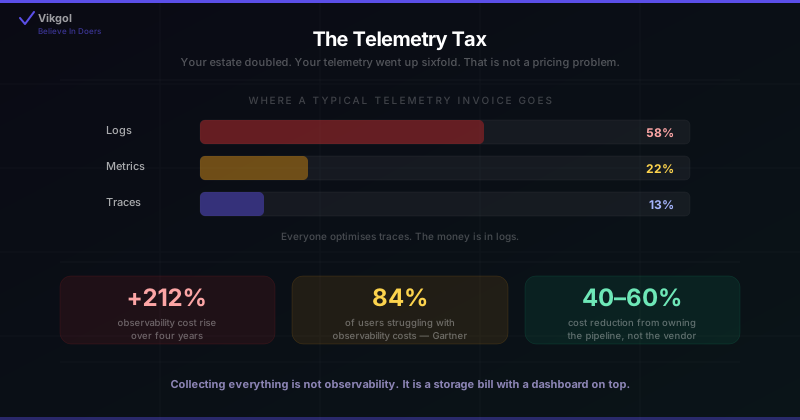
A monolith emitted one log stream and a few dozen metrics. Forty services behind a service mesh emit forty log streams, sidecar logs, mesh access logs, per-pod metrics, per-route metrics, and a trace for every request that crosses a boundary.
The estate doubled. The telemetry went up sixfold. That is why the observability cost per host looks wrong to everyone who last priced it three years ago, and why the median enterprise now spends somewhere between $1 million and $10 million a year to see what its systems are doing.
Most responses to this are a procurement exercise — renegotiate with the vendor, or move to a cheaper one. That addresses the rate and leaves the volume untouched, which is why teams who switch platforms are usually back in the same conversation eighteen months later.
Monitoring tells you that something is wrong — a threshold crossed, a check failed. Observability is the property of being able to work out why, including for failures nobody predicted. The three signals are metrics (cheap numeric time series, good for "is it bad?"), logs (expensive detailed events, good for "what exactly happened?"), and traces (request paths across services, good for "where did the time go?"). Collecting all three is not observability. Being able to answer a question you did not anticipate is.
Where the Money Actually Goes
Across a typical forty-service estate, a telemetry invoice splits roughly like this:
| Signal | Share of invoice | What it scales with | Primary lever |
|---|---|---|---|
| Logs | ~58% | How talkative your code is — not your traffic | Log levels, structured events, drop rules at the collector |
| Metrics | ~22% | Cardinality — the number of unique label combinations | Label hygiene, pre-aggregation, cardinality limits |
| Traces | ~13% | Request volume and what you attach to each span | Tail-based sampling, span attribute discipline |
| Query and compute | ~7% | High-cardinality queries and dashboard refreshes | Pre-aggregation, sensible refresh intervals |
Note what that means in practice: everyone optimises traces, because sampling is the well-documented technique. The money is in logs. A sampling strategy that halves trace volume saves about 6% of the bill. Enforcing log levels in production and dropping health-check noise at the collector can save four times that.
Cardinality: The Line Item Nobody Predicts
Metrics are the cheapest signal per data point and the easiest to make catastrophically expensive, because the cost does not scale with how often you record a metric. It scales with how many unique label combinations exist.
# Fine — 3 labels, small enum values
http_requests_total{
  service="checkout",      # ~40 values
  method="POST",           # ~6 values
  status="200"             # ~15 values
}
# 40 × 6 × 15 = 3,600 series. Costs nothing.

# Catastrophic — one unbounded label
http_requests_total{
  service="checkout",
  method="POST",
  status="200",
  user_id="a7f3c1e9-..."    # 2,000,000 values
}
# 3,600 × 2,000,000 = 7.2 BILLION series.
# Same code path. Same traffic. One extra label.
The rule is simple and almost never written down: metric labels must be low-cardinality enums. Service names, HTTP methods, status codes, regions, environments. Anything per-user, per-request, per-session or per-trace belongs in a log or a span attribute, where storage is linear rather than multiplicative.
Not through carelessness. An engineer debugging a specific customer's issue adds a user ID label, finds the problem, and forgets to remove it. The metric is correct, the dashboard works, and nothing fails. The invoice arrives five weeks later and nobody connects it to a two-line change. A cardinality alert on new label values — not a quarterly audit — is what catches this while it is still cheap.
OpenTelemetry Will Not Save Your Bill By Itself
OpenTelemetry is the right standard and the right bet. It gives vendor independence, it is becoming the default, and real migrations report 50–72% cost reductions against previous vendors.
But there is an uncomfortable intermediate step that catches teams out: OpenTelemetry auto-instrumentation often increases telemetry volume by three to five times versus hand-rolled tracing, because it instruments everything by default rather than the handful of spans a human would have chosen.
Teams adopt OTel to cut costs, deploy auto-instrumentation, and watch the bill go up before it comes down. The saving is real — it comes from owning the pipeline, not from the SDK.
- · All telemetry ingested, then filtered in their UI
- · You pay per GB for data you never query
- · Health checks and debug logs billed at full rate
- · Cardinality discovered on the invoice
- · Retention set once, globally, for everything
- · Leaving means re-instrumenting
- · OTel Collector filters, samples and routes at the edge
- · You pay only for what reaches the vendor
- · Health-check spans dropped before egress
- · Cardinality capped at the collector
- · Retention tiered per data set
- · Switching vendors is a config change
Teams running their own collector pipeline report cutting log and trace costs by 50–70% without losing anything they were actually querying. One documented e-commerce case went from 100M spans and 2TB of logs a day at $25,000 a month, to 35M spans and 800GB at $14,250 — a 43% reduction, with no reported loss of diagnostic ability.
Retention Is Not One Setting
The most common configuration mistake is a single global retention period, usually set to whatever the longest compliance requirement demands. That stores debug traces for seven years because an audit log needed to be.
Diagnostic value decays at very different rates by signal. Tier it:
| Data set | Hot (queryable) | Warm | Archive | Why |
|---|---|---|---|---|
| Traces | 7–14 days | None | Errors only, 90 days | Nobody debugs a successful request from six weeks ago |
| Application logs | 14–30 days | 90 days | 1 year, cold storage | Incident investigation window, then compliance only |
| Audit and security logs | 30 days | 1 year | As regulation requires | This is the one with the long legal tail — only this one |
| Metrics | 15 months, downsampled | — | — | Cheap to keep, and you want year-on-year comparison |
Alerts: Fewer, and Tied to Symptoms
A typical DevOps team receives over 2,000 alerts a week, of which roughly 3% require any action. That is not a monitoring configuration — it is a system for training humans to ignore alerts.
The fix is a rule that is easy to state and politically hard to apply: alert on symptoms users can feel, not on causes.
- · CPU above 80% on any node
- · Memory above 90%
- · Disk 75% full
- · A pod restarted
- · Queue depth above 1,000
- · Fires constantly, resolves itself, trains people to ignore
- · Checkout error rate above 1% for 5 minutes
- · p99 latency above SLO for 10 minutes
- · Error budget burning faster than 10× normal
- · Orders per minute below forecast floor
- · Fires rarely, and every page means something
- · Causes stay as dashboards, not pages
CPU at 85% with latency inside SLO is not an incident. It is a well-utilised node. Paging someone for it at 3am costs real money in attention and goodwill, and buys nothing.
If this fires at 3am, is there something a human must do right now? If the honest answer is "look at it in the morning", it is a ticket. If it is "nothing, it usually resolves itself", delete it. Most teams can remove 60–80% of their alert rules on this test alone, and incident response gets measurably faster — because the remaining alerts are believed.
Choosing the Right Signal
AI Workloads Change the Shape
One thing that was not in last year's version of this article: teams adding AI capabilities report two to five times increases in observability data volume. Model serving, inference pipelines and agent workflows are chatty by nature, and the useful signals are different ones.
If you are running LLM features in production, the things worth instrumenting are not CPU and memory. They are token counts per request, cost per conversation, time to first token, retrieval relevance scores, and error and fallback rates by model. Those belong in metrics and traces from the start, because retrofitting them after the cost conversation has already started is considerably harder.
A 30-Day Cost and Signal Review
Break the invoice down by signal and service
Logs, metrics, traces, and which services generate each. Most teams have never seen this split, and it usually surprises them — one chatty service frequently accounts for a disproportionate share of log volume.
Week 1Run a cardinality audit
List your top metrics by active series count. Look for any label that could be an identifier. One unbounded label usually explains most of a metrics bill, and removing it is a two-line change.
Week 1Enforce log levels in production
WARN and ERROR by default; INFO only where a specific need justifies it; DEBUG never in a hot path. This is the single largest cost line and the easiest to reduce without losing anything you query.
Week 2Put an OTel Collector in front of the vendor
Drop health checks and known-noise spans, apply tail-based sampling, cap cardinality, route by data set. Filtering before egress is where 50–70% of log and trace cost reduction comes from.
Week 2–3Tier retention per data set
Traces 7–14 days hot with errors archived; application logs 14–30 days then cold; audit logs on their own, longer schedule. One global retention period is almost always wrong and almost always expensive.
Week 3Delete alerts that have never led to an action
Export 90 days of alert history and count actions per rule. Delete or downgrade anything with a near-zero rate. Then add cardinality and volume alerts, so the next spike is caught in days rather than on the invoice.
Week 4Frequently Asked Questions
Not Sure Where Your Telemetry Spend Is Going?
We do AWS architecture, observability pipelines and incident automation for production systems. Book a free 30-minute call — we'll look at your invoice split and tell you honestly what is recoverable and what you need to keep.